DOM On Chart
User Guide
Introduction
The DOM On Chart (Depth of Market On Chart) indicator for NinjaTrader 8 is designed to merge real-time Order Book reading (DOM) directly with chart analysis. It displays real-time Bid and Ask volumes, executed trades (Inside Print), and Delta per price level directly on the right side of the chart, allowing traders to perform Order Flow analysis without leaving the chart window.
System Requirements
- NinjaTrader 8 (latest version recommended).
- A data provider that supports tick-level data and market depth
- (e.g., Kinetick, CQG, or Rithmic).
- Windows OS (as NinjaTrader is Windows-based).
- Minimum: 8GB RAM, modern CPU for smooth performance with high-volume instruments.
Installation
- Download the Indicator: Obtain the compiled DLL from your purchase/download link.
- Import into NinjaTrader:
- Open NinjaTrader.
- Go to Tools > Import > NinjaScript Add-On.
- Select the file and follow the prompts.
- Restart NinjaTrader if prompted.
- Verify Installation:
- Open a chart.
- Right-click > Indicators.
- Look for "●⬤【 DOM On Chart】⬤●" under the "FlowMatriX" folder in the indicator list.
- If it doesn't appear, check the NinjaTrader logs for errors (Help > Mail to Platform Support).
Important: After import, DOM On Chart will appear in the "FlowMatriX" category in the Indicators window, not in the main list.
Adding the Indicator to a Chart
- Open a chart for your instrument (e.g., ES futures on a 1-minute chart).
- Right-click the chart > Indicators.
- Expand the "FlowMatriX" folder.
- Select "●⬤【 DOM On Chart】⬤●".
- Configure parameters as needed (see below).
- Click OK to apply. The DOM will appear in the right of the chart panel.
- For best results, use on charts with tick data enabled (Chart Properties > Data Series > Load data based on: Tick).
1. DOM Behavior
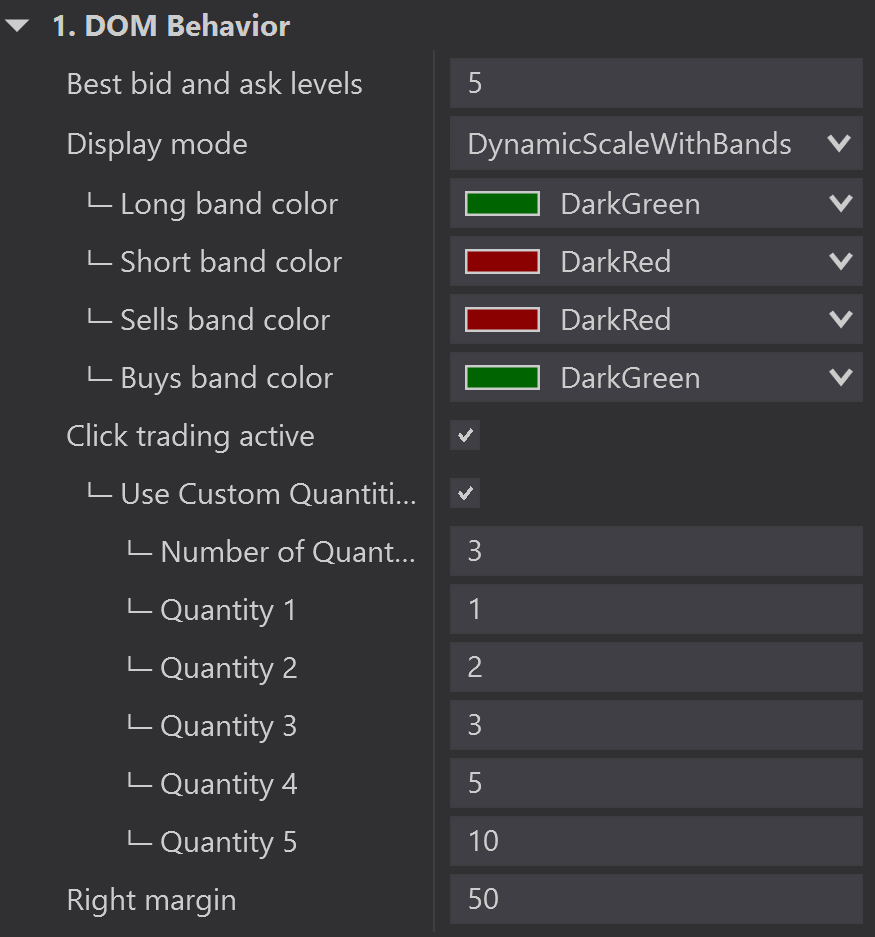
This section controls the core functionality, display logic, band colors, and interactive trading settings of the Depth of Market (DOM) display.
-
Best bid and ask levels (Default: 5): Number of top-of-book levels used to normalize the width of Bid/Ask volume bars.
-
Display mode (Default: DynamicScaleWithBands): Primary display logic for price levels. Options: DynamicScaleWithBands (auto-scales/switches to bands), FixedScale (fixed levels), or BandsOnly.
-
└─ Long band color (Color): Background color for the Buy/Long Band in Band Trading mode.
-
└─ Short band color (Color): Background color for the Sell/Short Band in Band Trading mode.
-
└─ Sells band color (Color): Secondary color setting for the Sell/Short Band.
-
└─ Buys band color (Color): Secondary color setting for the Buy/Long Band.
-
└─ Static levels to display (Default: 51): Total number of levels displayed when
Display modeis set to FixedScale. -
Click trading active (Default: True): Enables/Disables the ability to place orders by clicking on price levels or bands.
-
└─ Use Custom Quantities (Default: False): If True, the quantity buttons in the control panel use the values defined below (Quantity 1-5).
-
└─ Number of Quantity Buttons (Default: Varies): Sets the number of contract size buttons visible in the control panel (Max 5). (Range: 1-5)
-
└─ Quantity 1 (Default: Varies): Contract size for the first quantity button. (Range: 1-1000)
-
└─ Quantity 2 (Default: Varies): Contract size for the second quantity button. (Range: 1-1000)
-
└─ Quantity 3 (Default: Varies): Contract size for the third quantity button. (Range: 1-1000)
-
└─ Quantity 4 (Default: Varies): Contract size for the fourth quantity button. (Range: 1-1000)
-
└─ Quantity 5 (Default: Varies): Contract size for the fifth quantity button. (Range: 1-1000)
-
Right margin (Default: 50f): Space (in pixels) added to the right of the chart to prevent the DOM display from being cut off.
2. Price Column
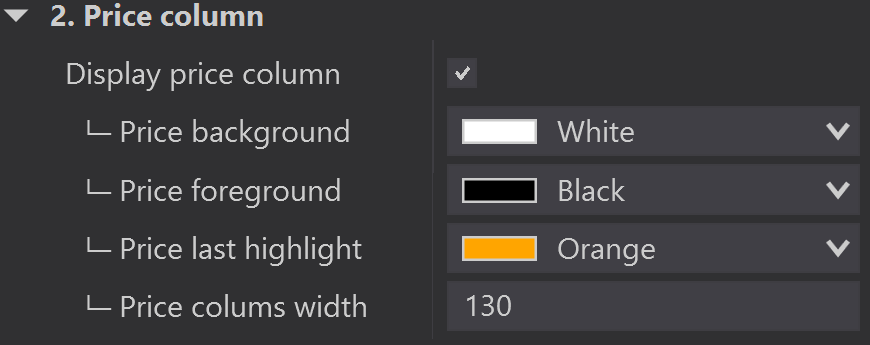
Controls the visibility, physical width, and all color settings for the column that displays the price levels within the DOM on the chart..
-
Display price column (Default: True): Shows/Hides the central column displaying the price levels.
-
└─ Price background (Color): Sets the background color for the price levels in the column.
-
└─ Price foreground (Color): Sets the text color for the price values displayed in the column.
-
└─ Price last highlight (Color): Background color of the last traded price.
-
└─ Price colums width (Default: Varies/130): Sets the width (in pixels) of the entire Price Column area.
3. Inside Print
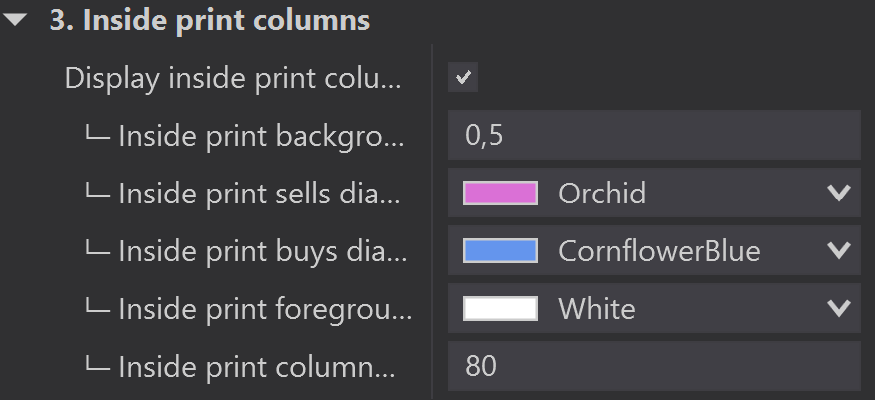
Manages the visibility, color, transparency, and width of the column that displays the volume of executed trades (known as 'Inside Print') at each price level.
-
Display inside print columns (Default: True): Shows/Hides the column that displays the total volume of buyer-initiated and seller-initiated trades executed at each price.
-
└─ Inside print background transparency (Default: Varies/0.5): Sets the opacity for the background bars representing executed volume. (Range: 0.1 to 1.0)
-
└─ Inside print sells diagram (Color): Sets the color for the volume bars representing seller-initiated trades (Short Trades).
-
└─ Inside print buys diagram (Color): Sets the color for the volume bars representing buyer-initiated trades (Long Trades).
-
└─ Inside print foreground (Color): Sets the text color for the volume numbers displayed within the Inside Print column.
-
└─ Inside print column width (Default: Varies/80): Sets the width (in pixels) of the entire Inside Print column.
4. Bid & Ask Columns
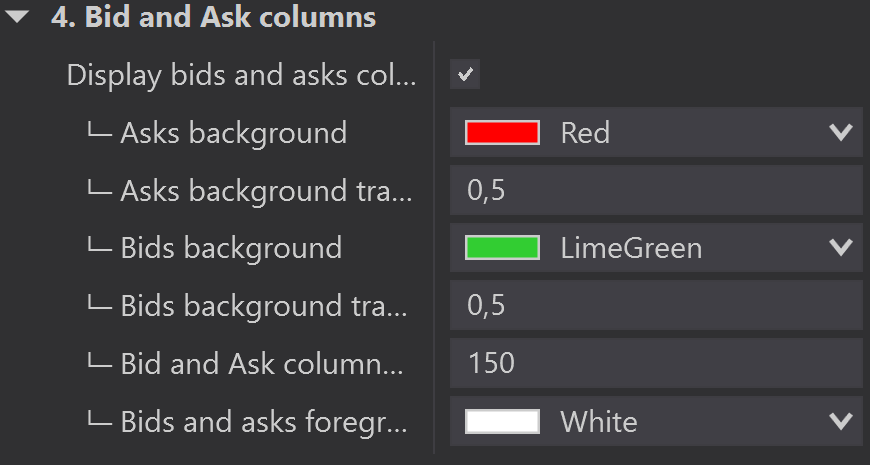
Controls the visibility, colors, transparency, and width of the columns that display the pending order volume (Market Depth) for both buyers (Bids) and sellers (Asks) at various price levels.
-
Display bids and asks columns (Default: True): Shows/Hides the columns displaying the pending order volume (Market Depth) on either side of the price column.
-
└─ Asks background (Color): Sets the color for the background bars representing pending Ask volume (Offers/Sellers).
-
└─ Asks background transparency (Default: Varies/0.5): Sets the opacity for the Ask volume bars. (Range: 0.1 to 1.0)
-
└─ Bids background (Color): Sets the color for the background bars representing pending Bid volume (Demand/Buyers).
-
└─ Bids background transparency (Default: Varies/0.5): Sets the opacity for the Bid volume bars. (Range: 0.1 to 1.0)
-
└─ Bid and Ask column width (Default: Varies/150): Sets the maximum width (in pixels) shared between the Bid and Ask columns.
-
└─ Bids and asks foreground (Color): Sets the text color for the volume numbers displayed within the Bid and Ask columns.
5. Delta Column
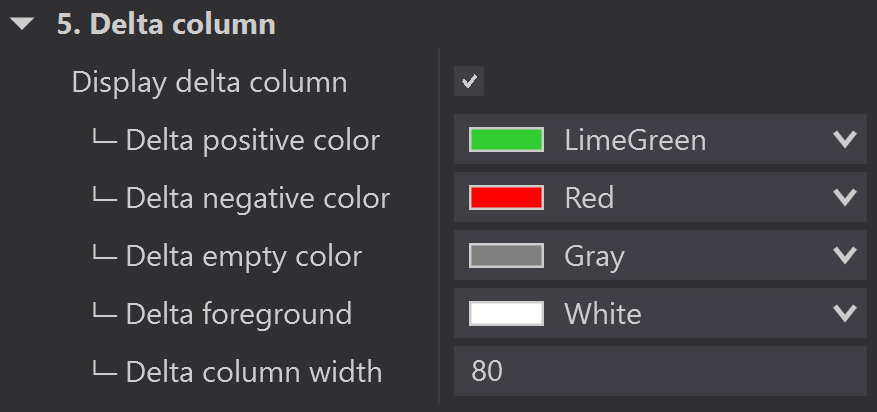
Manages the visibility, color coding (for positive, negative, and zero values), and width of the column that displays the cumulative trade Delta (Buyer Trades - Seller Trades) at each price level.
-
Display delta column (Default: True): Shows/Hides the column that displays the cumulative trade Delta for each price level.
-
└─ Delta positive color (Color): Sets the color for the Delta bar when the cumulative Delta is positive (more buyer-initiated volume).
-
└─ Delta negative color (Color): Sets the color for the Delta bar when the cumulative Delta is negative (more seller-initiated volume).
-
└─ Delta empty color (Color): Sets the color for the Delta bar when the cumulative Delta is zero.
-
└─ Delta foreground (Color): Sets the text color for the numeric Delta value displayed.
-
└─ Delta column width (Default: Varies/80): Sets the width (in pixels) of the entire Delta column.
6. Last Price
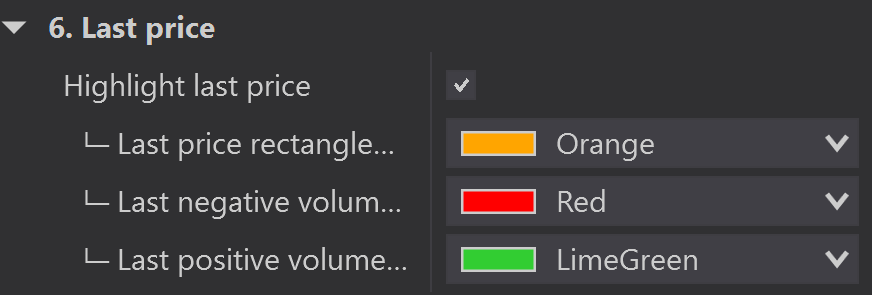
Controls the visual highlighting and color coding applied to the specific price level where the most recent trade was executed.
-
Highlight last price (Default: True): Enables/Disables the visual indicator that highlights the level of the last traded price.
-
└─ Last price rectangle color (Color): Sets the color for the rectangle or border drawn around the last traded price level.
-
└─ Last negative volume color (Color): Sets the color for the highlighting/text when the last trade was seller-initiated (Negative Delta trade).
-
└─ Last positive volume color (Color): Sets the color for the highlighting/text when the last trade was buyer-initiated (Positive Delta trade).
7. Font & Spacing
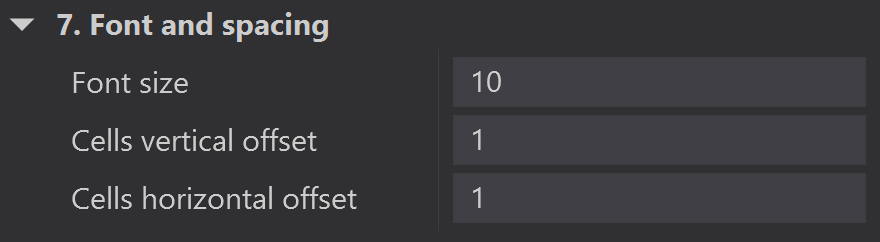
Controls the typography and layout density of the DOM display by adjusting the font size and the spacing between the price levels (vertical) and the data columns (horizontal).
-
Font size (Default: Varies/10): Sets the overall size of the text (in points) used to display prices, volumes, and Delta values.
-
Cells vertical offset (Default: Varies/1): Sets the additional vertical space (in pixels) added between each price level/row.
-
Cells horizontal offset (Default: Varies/1): Sets the additional horizontal space (in pixels) added between the different data columns (e.g., Price, Inside Print, Bid/Ask, Delta).
Additional Information
Band Trading (Quick Mode)
-
When the indicator switches to Band Trading Mode (due to significant zoom-out or by selecting
BandsOnly), the chart displays bands that allow instant trading by clicking:-
Clicking the Buy Band submits a Buy order.
-
Clicking the Sell Band submits a Sell order.
-
The quantity is defined by the quantity buttons in the control panel.
-
Click Trading Functionality
-
The indicator supports trading directly on the displayed DOM prices (
ClickTradingActivated = True).-
Buy : Click a price level in the Ask column (or Buy Band) to submit a Buy order (Buy Limit or Buy Market, depending on the price).
-
Sell : Click a price level in the Bid column (or Sell Band) to submit a Sell order (Sell Limit or Sell Market, depending on the price).
-
Troubleshooting
-
Q: My DOM On Chart is invisible or shows no data.
-
A : Ensure DisplayMode is not set to a mode incompatible with your zoom level. If using FixedScale, verify that you have tick data and market depth enabled for the contract.
-
A : Check that you have a valid license (
VendorLicense(740)). -
A : Make sure you have clicked the ON button in the Chart Trader control panel.
-
If issues persist, export your workspace and contact support.
Support and Updates
For questions, feature requests, or bugs, visit our DISCORD. Updates are released periodically—check your download link.
Happy trading with DOM On Chart!
Last Updated: December 7, 2025
DISCORD
Collaborative Community
FlowMatriX grows through the voices of traders at every level. Our Discord community is where curious beginners meet experienced analysts, and where your feedback directly shapes our tools.
What You'll Find
Direct Developer Access – Questions about setup, configuration, or how a feature works? Get answers straight from the team that builds FlowMatriX.
Learn from Others – See how traders use the tools across different markets and strategies. Share your discoveries and learn new approaches.
Trading Discussions – Beyond tool configuration, discuss order flow, volume analysis, and market concepts with traders who love diving deep into market structure.
Whether you're just starting with volume analysis or you've been reading the tape for years, you'll find your place here.
PRICING
Free Pack
Premium Pack