Skip to content
FlowMatrix_Ninjatrader8

Why Choose FlowMatriX ?

01

04

Advanced Technical Expertise

Our team combines deep development expertise with practical trading knowledge. We're not just coders, we're traders who understand your real needs.

  • Performance-optimized algorithms
  • Robust code tested in real conditions
  • Scalable and maintainable architecture
02

04

Continuous Innovation

The market evolves, so do our tools. We constantly invest in research and development to offer you the most advanced and relevant features.

  • Regular updates with new features
  • Integration of latest analysis techniques
  • Ongoing technology monitoring
03

04

Uncompromising Quality

Every FlowMatriX product goes through rigorous testing and optimization phases. We only release when we're convinced of the exceptional quality of our work.

  • Exhaustive testing in real market conditions
  • Performance optimization
  • Zero tolerance for bugs
04

04

User-Oriented Philosophy

We create tools that we use daily ourselves. Every feature is designed to solve a real problem encountered by traders.

  • Intuitive and ergonomic interface
  • Complete customization to your preferences
  • Minimal learning curve

INDICATORS

DOM On Chart

clickTrading

Click Trading

Execute orders instantly from the DOM displayed directly on your chart. Click any price level in the depth-of-market ladder to place trades. Full order book data integrated into your chart for seamless one-click trading.

scroll

Vertical Scroll

Navigate through price levels effortlessly with your mouse wheel. Scroll up or down to explore deeper market depth while staying focused on price action and the liquidity levels that matter most to your trade.

autoScalle-1

Auto Scale

Switch seamlessly between DOM cell view and dual trading bands mode, the display automatically adjusts to maintain optimal visibility. The interface scales intelligently to fit your workflow.

Tape Reader

Tape Reader

See every trade instantly with ultra-fast display. Price, volume, time — all essential data at your fingertips.

Sweep Detection

Automatically identifies directional sweeps and absorptions. Color-coded rectangles on the chart to instantly spot key zones.


Volume Bubbles

Graphical visualization of large trades with bubbles sized proportionally to volume. Smart merging of nearby trades for better clarity.


Live Statistics

Real-time delta, Buy/Sell ratios, cumulative volume — all the metrics you need for informed decisions.

Sound Alerts

Never miss a critical event! Customizable alerts for sweeps and large trades, with configurable sounds.

Full Custom

Colors, sizes, symbols, opacity — every aspect is configurable to perfectly match your trading style.

Volume Profile

Volume Profile Parametres INDI

Core Features

Multiple Display Modes

  • Standard: Total volume distribution
  • Buy/Sell: Separated buyer and seller volume
  • Delta: Net buying/selling pressure
  • Standard + Delta: Combined analysis view

Automatic Level Detection

  • Point of Control (POC): Highest volume price level
  • Value Area: Configurable zone containing 70% of volume
  • VAH/VAL: Value area boundaries

Dynamic Extensions POC and Value Area lines automatically extend until price crosses them, allowing you to track untested levels in real-time.

Flexible Timeframes Build profiles by Session, Daily, Weekly, or Monthly periods with configurable tick resolution for precise high-frequency analysis.

VWAP

Core Features

Multiple Period Types

  • Daily: Reset at each session start
  • Weekly: Reset at week beginning
  • Monthly: Reset at month start

Standard Deviation Bands Three configurable sets of standard deviation bands (1σ, 2σ, 3σ) to identify price extremes and potential reversal zones. Customize multipliers for each band set to match your trading style.

Previous Session Levels Display previous period VWAP and bands to identify reference levels from prior trading sessions. Track how current price action relates to previous fair value zones.

Flexible Price Sources Choose from multiple calculation methods: Close, HLC3, HL2, OHLC4, or HLCC4 to match your analysis preference.

Parametres Vwap
ProJector Integration Share VWAP data with the ProJector indicator to display multiple timeframes simultaneously on a lightweight chart without performance impact.

ProJector - Multi-Timeframe VWAP Display

A Unified View Across Time Horizons

The FlowMatriX ProJector serves as a thoughtful companion to the VWAP indicator, bringing together Daily, Weekly, and Monthly perspectives within a single view. Rather than calculating these levels independently, ProJector receives prepared data from your existing VWAP instances, allowing you to maintain a comprehensive multi-timeframe awareness without additional computational burden.

What ProJector Offers

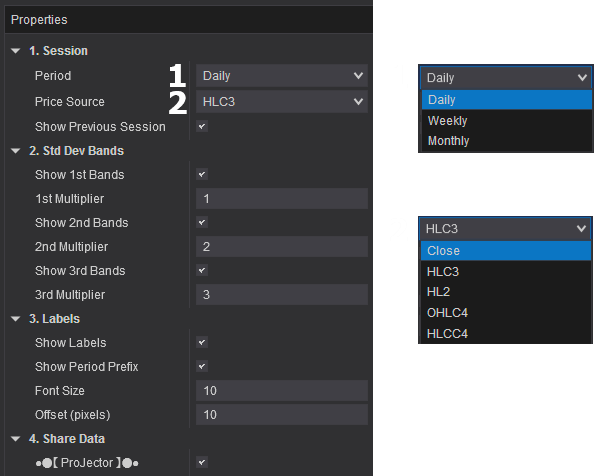
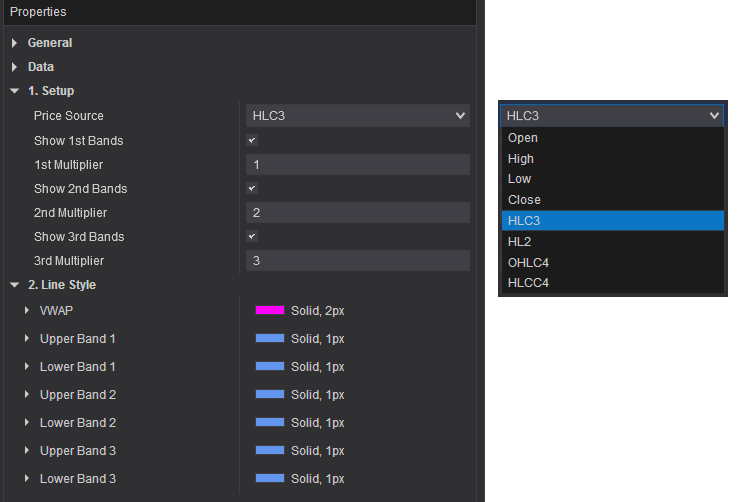
Perspectives Across Time ProJector brings together intraday, weekly, and monthly VWAP levels alongside their standard deviation bands, creating a layered view of how different market participants perceive value across various time horizons.

Memory of Past Sessions Beyond current levels, display up to 1000 historical periods for each timeframe, preserving the context of where fair value resided in previous sessions and how those zones continue to influence price behavior.

Temporal Context Optional age labels help you understand the recency of historical levels, marking them as one, two, or three periods removed from the present—a subtle but useful reference for gauging relevance.

Efficient Architecture Through the DataHub system, pre-calculated values flow from your VWAP indicators rather than being computed redundantly. This design allows extensive historical context without the performance costs typically associated with such rich visual information.

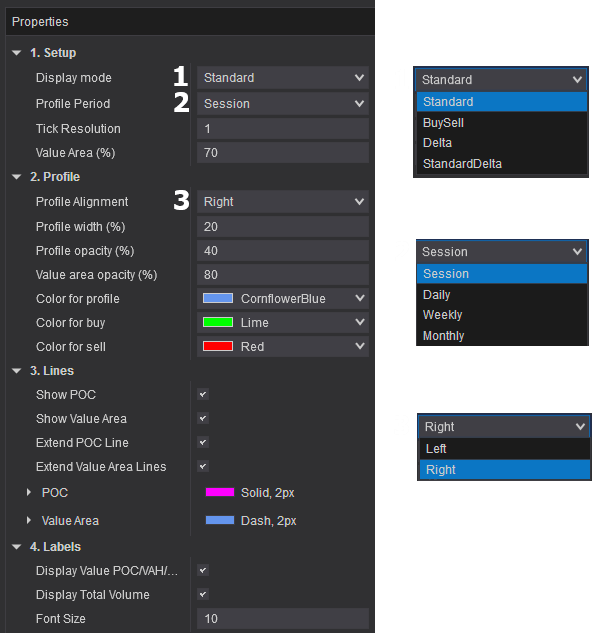
Selective Visibility Each timeframe can be shown or hidden independently, as can the distinction between current and historical levels, letting you adjust your view to match the specific context you're observing.

The Value of This Approach

Markets operate across multiple timeframes simultaneously. ProJector helps you see how shorter-term price action relates to longer-term fair value anchors, revealing moments of alignment or tension. Previous VWAP levels often remain relevant long after their originating period has closed, acting as significant reference points that ProJector maintains without cluttering your workspace.

The shared data architecture prioritizes efficiency—a single calculation informs multiple displays. This thoughtful resource use allows you to build richer analytical views while maintaining chart responsiveness, with independent timeframe controls that let you refine your perspective fluidly as market conditions evolve.

Getting Started

Add VWAP indicators configured for your desired periods—typically Daily, Weekly, and Monthly. Enable data sharing on each instance, then add ProJector to gather and display all shared information. Finally, adjust visibility and historical depth settings to suit your analytical preferences.

Technical Characteristics

Optimized rendering with configurable line extension and visual styling inherited from source VWAP indicators ensures consistency across your analysis. The design particularly suits multi-monitor trading environments where maintaining coherent reference levels across different chart views becomes important.

DRAWING TOOLS

Anchored VWAP

AnchoredVWAPgif2
DT_VWAP_Parameters_v2


The Anchored VWAP tool lets you calculate volume-weighted average price from any point on your chart, essential for tracking institutional positions and understanding fair value from key market events.

Key Features

  • Flexible Price Sources: Choose from 8 calculation methods (HLC3, HLCC4, OHLC4, HL2, or individual OHLC values) to match your analysis style
  • Triple Standard Deviation Bands: Display up to three sets of standard deviation bands with customizable multipliers (default 1σ, 2σ, 3σ)
  • True Volume Weighting: Uses actual tick-by-tick volume data for accurate VWAP calculation, not bar-based approximations
  • One-Click Anchoring: Simply click any bar to start your VWAP calculation, perfect for anchoring to significant events like earnings, Fed announcements, or key reversals
  • Clean Visual Design: Distinctive anchor marker with extending lines clearly shows your reference point
Perfect For: Tracking intraday institutional levels, identifying mean reversion opportunities, and understanding volume-weighted fair value from key market events.


Volume Profile

The FlowMatriX Volume Profile reveals the hidden story behind price action by displaying volume distribution across price levels within any time range you define.

Key Features

  • Dynamic or Fixed Modes: Lock your profile to live data for real-time updates, or fix it to analyze completed sessions
  • Point of Control (POC): Instantly identify the price level with the highest traded volume, where institutional activity concentrates
  • Value Area Analysis: Visualize the 70% value area (customizable) to understand where the majority of trading occurred
  • Delta Profiling: Switch between standard volume display and buy/sell delta visualization to reveal directional pressure at each price level
  • Line Extensions: Automatically extend POC and Value Area lines forward in time to track key reference levels
  • Total Volume Display: See aggregate volume for the entire profile range at a glance
  • Professional Status Indicators: Clear visual feedback shows whether your profile is loading, updating live, or fixed
Perfect For: Identifying support/resistance zones, analyzing auction market theory concepts, and understanding institutional order flow distribution.
DT_VolumeProfile_Parameters

VP ● VWAP

DTVPVWAPESv3

VOLUME PROFILE + VWAP

The Ultimate Range Analysis Tool

Why choose between Volume Profile and Anchored VWAP when you can have both? The VP ● VWAP tool seamlessly combines volume distribution analysis with volume-weighted average price, all anchored to the same time range for perfect alignment.

Key Features

  • Unified Analysis: Volume Profile and Anchored VWAP share the same left anchor point, ensuring your VWAP calculation starts exactly where your profile begins

  • All Volume Profile Features: Full POC, Value Area, Delta display, line extensions, and status indicators
  • All VWAP Features: Complete standard deviation bands (3 sets), flexible price sources, and customizable multipliers
  • Flexible VWAP Extension: Choose to extend VWAP lines forward in time or limit them to the profile zone—adapt to your analysis workflow

  • Smart Mode Detection: Automatically tracks whether you're analyzing live or completed ranges

Perfect For: Comprehensive range analysis, combining auction theory with volume-weighted pricing, and identifying high-probability reversal zones where profile structure meets VWAP levels.

DISCORD

Collaborative Community

Our users are our best source of inspiration. We actively listen to your feedback and integrate your suggestions into our future developments.